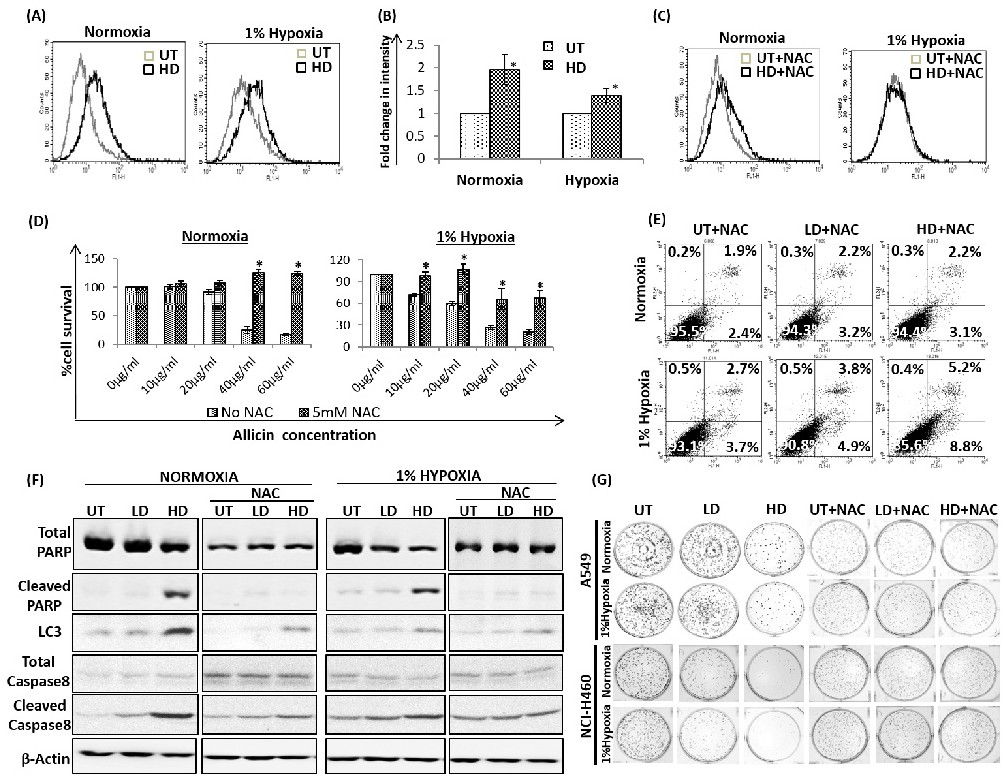
Fig. 3. Allicin induced ROS regulate autophagy and apoptosis in A549 cells. (A, B) Histogram overlay of 2′,7′-dichlorofluorescein fluorescing untreated (UT) and 40μg/ml (HD) allicin treated A549 cells cultured in normoxia and hypoxia as determined by flow cytometry and plot representing fold change in geometric mean fluorescence intensity of allicin treated cells wherein geometric mean fluorescence intensity of untreated cells was arbitrary set as 1.0. The bars represent the mean ± standard deviation calculated from three independent experimental values. * represents p<0.05 compared to untreated cells. (C) The pretreatment of cells with antioxidant N-acetylcysteine (NAC) quenches allicin induced increase in ROS leading to a reversal in the observed shift of fluorescent intensity in allicin treated cells. (D) MTT Assay representing cytotoxic effect of allicin in absence and presence of 5mM NAC on A549 cells cultured in normoxia and 1% hypoxia for 72hrs. The bars represent the mean ± standard deviation calculated from three independent experimental values. * represents p< 0.05 relative to its NAC untreated counterpart. (E) Flow cytometry analysis of Annexin V-FITC/PI stained A549 cells showing NAC treatment markedly reduced allicin induced percentage of the early apoptotic (Annexin V++/PI-) and late apoptotic (Annexin V+/PI+) cells in both normoxia and 1% hypoxia (F) Western blot analysis of total PARP, cleaved PARP, total caspase8 and cleaved caspase8 and LC3 proteins in NAC pretreated A549 cells confirming allicin induced apoptosis and autophagy in A549 cells as largely mediated by increased ROS accumulation. The western blot images of NAC untreated samples are same as in Fig. 2E, the picture is reused for comparison only. (G) Clonogenic assay showing NAC treatment markedly overcome allicin induced inhibition of colony formation in low dose (LD) of 10μg/ml as well as high dose (HD) of 40μg/ml allicin treated samples compared to untreated (UT) sample in normoxia and 1% hypoxia.